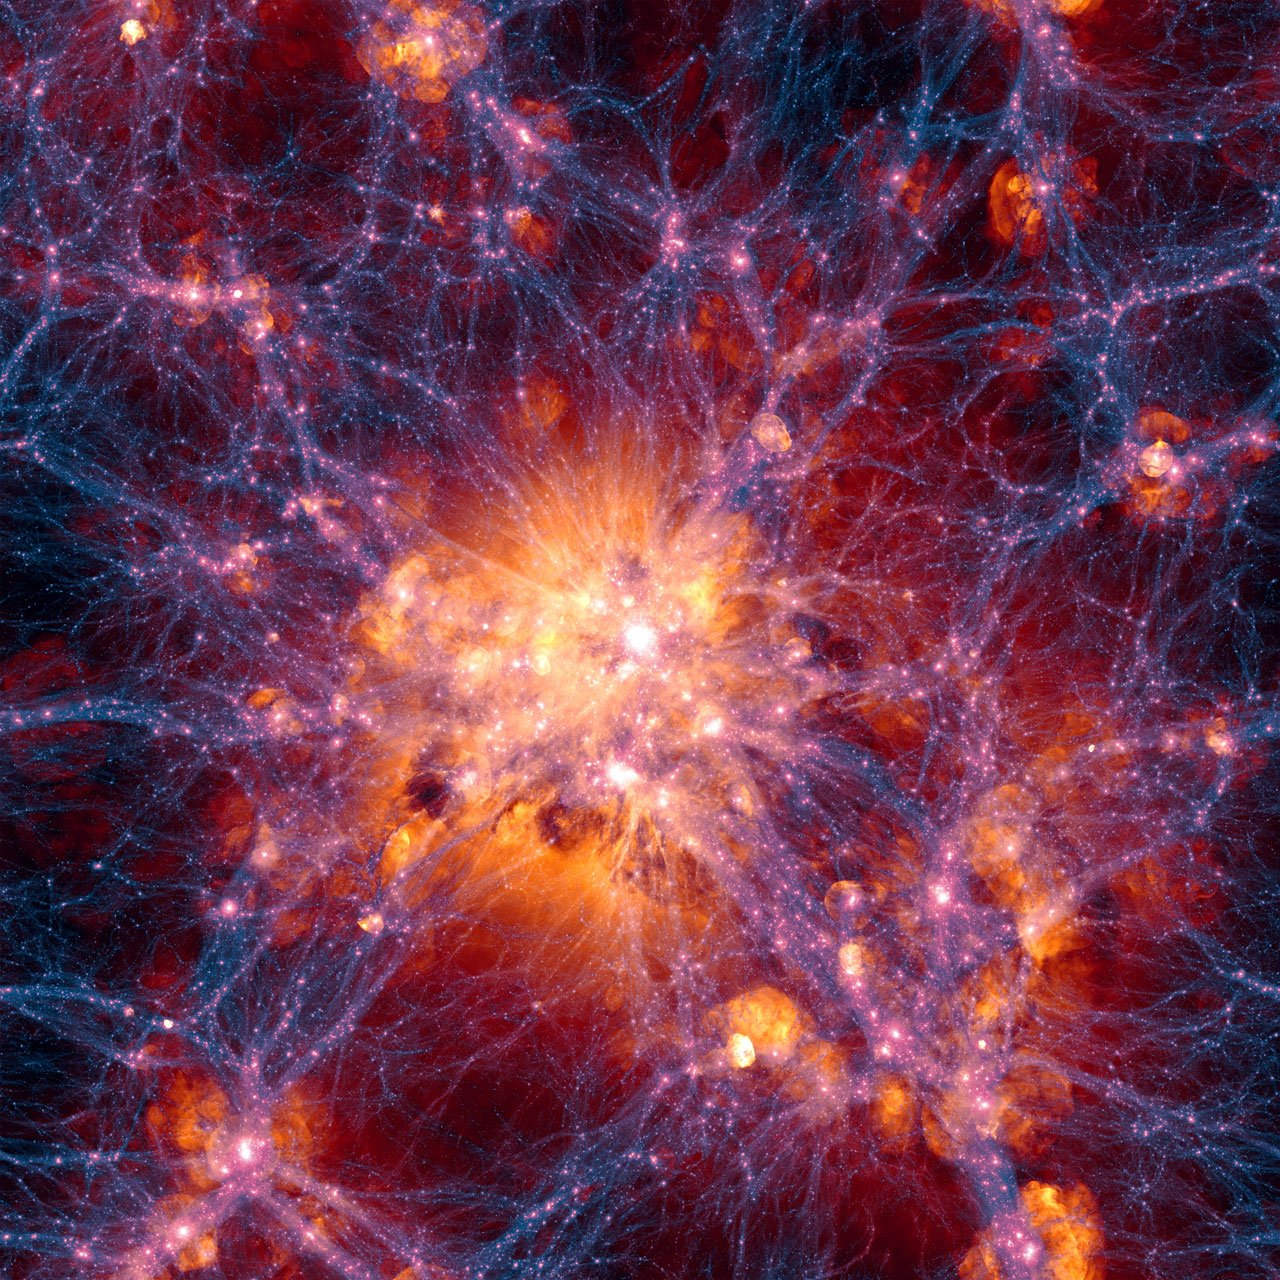
This very detailed simulation of large scale structure was created as part of the Illustris simulation.

 The distribution of dark matter is shown in blue and the gas distribution in orange.

 This simulation is for the current state of the Universe and is centered on a massive galaxy cluster.

 The region shown is about 300 million light-years across.
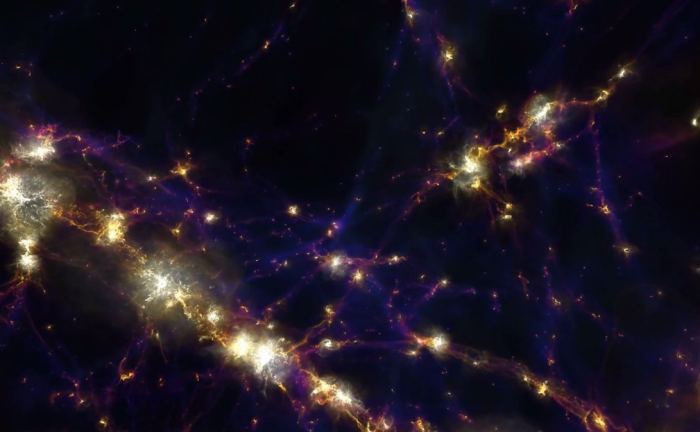
IllustrisTNG is a new simulation model for the Universe. It used over 24,000 processors
 over the course of more than two months to produce the largest hydrodynamic
 simulation project to date for the emergence of cosmic structures.
 Image: IllustrisTNG
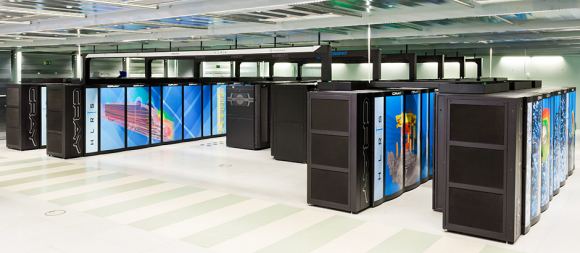
The Hazel Hen Supercomputer is based on Intel processors and Cray network technologies.
 Image: IllustrisTNG
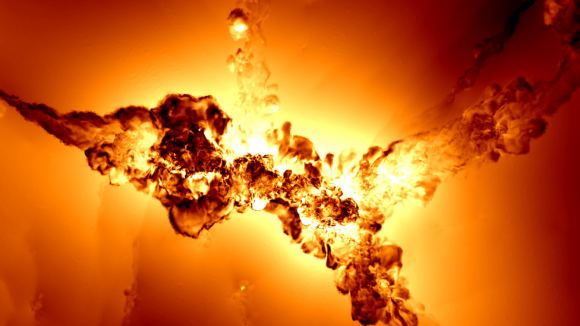
This is a rendering of gas velocity in a massive galaxy cluster in IllustrisTNG.
 Black areas are hardly moving, and white areas are moving at greater than 1000km/second.
 The black areas are calm cosmic filaments, the white areas are near super-massive black holes (SMBHs).
 The SMBHs are blowing away the gas and preventing star formation.
 Image: IllustrisTNG
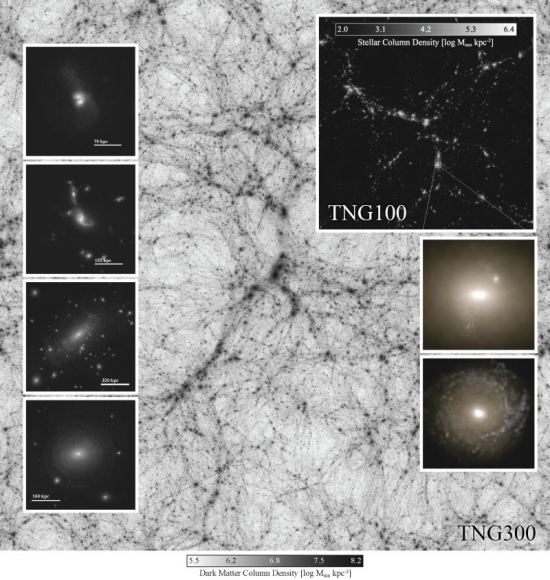
A composite image from IllustrisTNG. Panels on the left show galaxy-galaxy interactions
and the fine-grained structure of extended stellar halos. Panels on the right show stellar light projections
from two massive central galaxies at the present day. It’s easy to see how the light from massive central galaxies
overwhelms the light from stellar halos.
 Image: IllustrisTNG
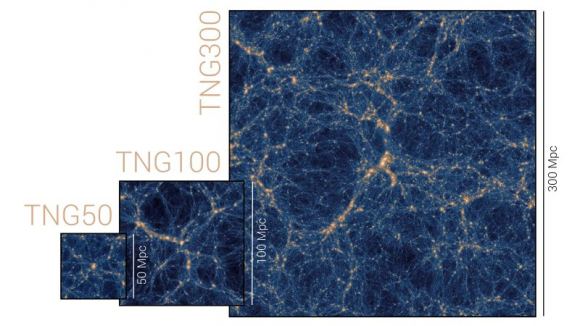
TNG 50, TNG 100, and TNG 300. Image:
IllustrisTNG
The Illustris project Home page
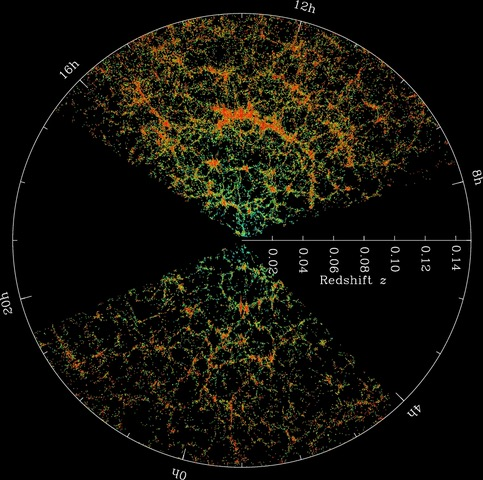
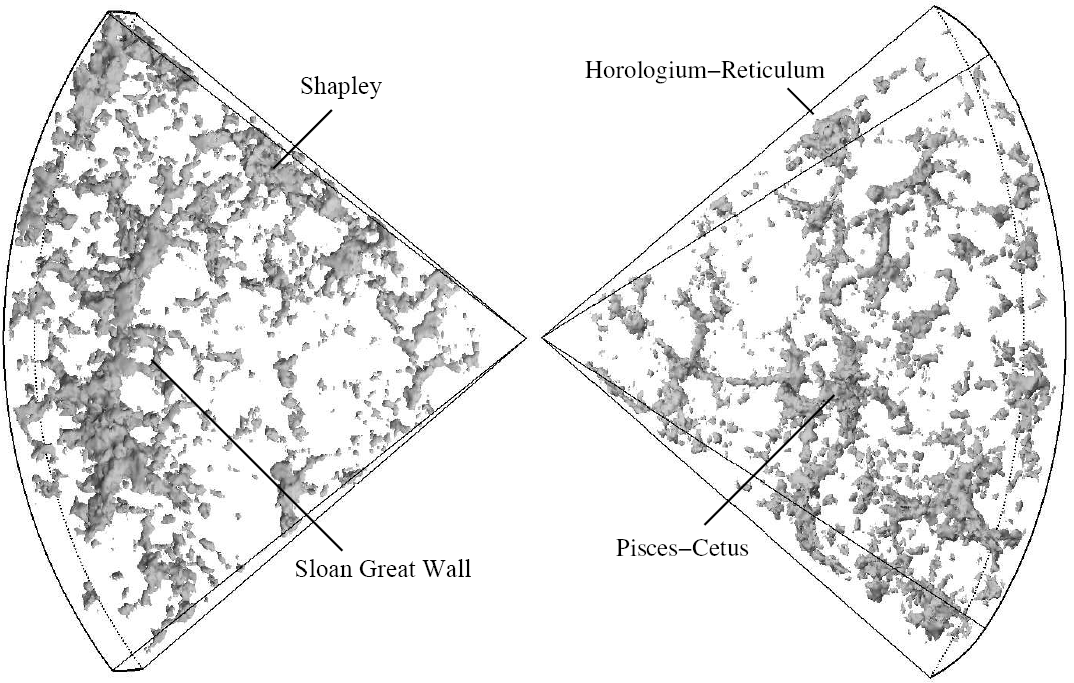
This is a map of the observable Universe from the Sloan Digital Sky Survey.
Orange areas show higher density of galaxy clusters and filaments.
 Image: Sloan Digital Sky Survey.
by VANESSA JANEK on JANUARY 5, 2015
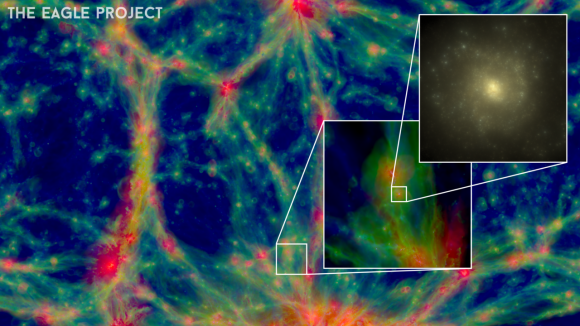
Zooming into an EAGLE galaxy. Credit: EAGLE Project Consortium/Schaye et al.

Astronomy is, by definition, intangible. Traditional laboratory-style experiments that utilize variables and control groups

are of little use to the scientists who spend their careers analyzing the intricacies our Universe.

 Instead, astronomers rely on simulations � robust, mathematically-driven facsimiles of the cosmos �

 to investigate the long-term evolution of objects like stars, black holes, and galaxies
by Tim Reyes on February 2, 2015
Vincent Van Gogh�s Starry Night is a finished work of art known to billions.

 After 13.8 billion years, the Universe remains an unfinished work.

 Planck Observatory data revealing the Milky Way�s magnetic field is morphed into a Starry Night of June 1889.

 (Credits: Vincent Van Gogh, ESA, Illustration � J.Schmidt, T.Reyes)


From the vantage point of a window in an insane asylum, Vincent van Gogh painted one of the most noted and valued artistic works in human history.

 It was the summer of 1889. With his post-impressionist paint strokes, Starry Night depicts a night sky before sunrise that undulates,

 flows and is never settled. Scientific discoveries are revealing a Cosmos with such characteristics.
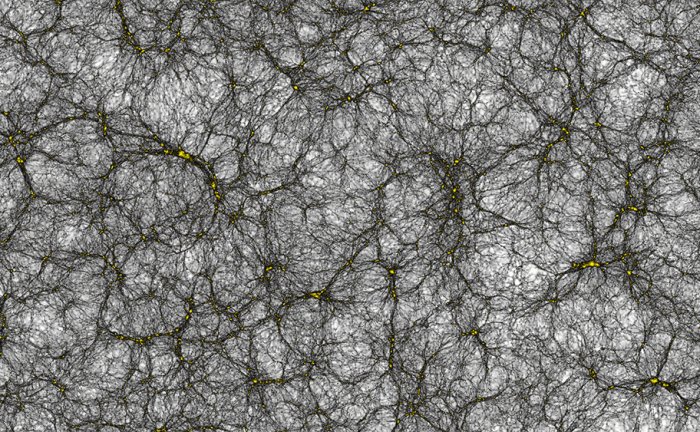
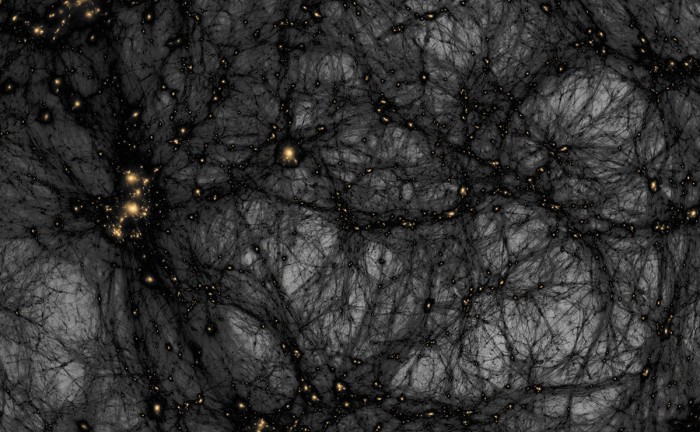
A section of the virtual universe, a billion light years across, showing how dark matter is distributed in space,
with dark matter halos the yellow clumps, interconnected by dark filaments. Cosmic void, shown as the white areas,
 are the lowest density regions in the Universe.
 Credit: Joachim Stadel, UZH
Published on Mar 12, 2015 Dark matter can't be seen or detected by any of our instruments, so how do we know it really exists? More stories at: Follow us on Twitter: @universetoday Follow us on Tumblr: Like us on Facebook: Google+ - Instagram - Team: Fraser Cain - @fcain Jason Harmer - @jasoncharmer Susie Murph - @susiemmurph Brian Koberlein - @briankoberlein Chad Weber - weber.chad@gmail.com Kevin Gill - @kevinmgill Created by: Fraser Cain and Jason Harmer Edited by: Chad Weber Music: Left Spine Down - “X-Ray” https://www.youtube.com/watch?v=KzWwJ...
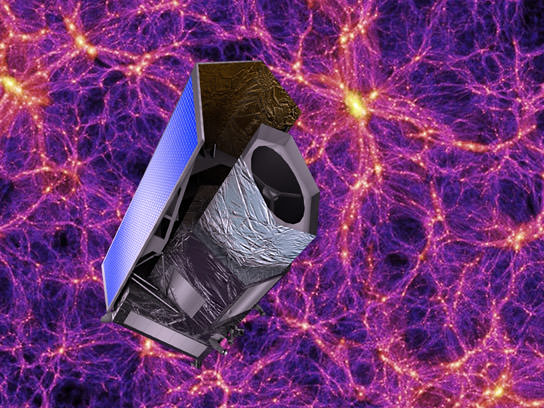
Artist impression of the Euclid probe, which is set to launch in 2020. Credit: ESA
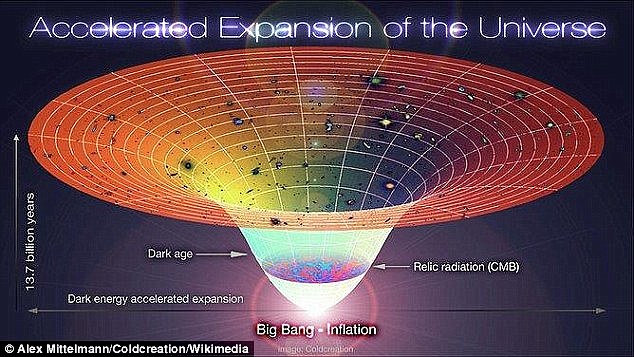
Diagram showing the Lambda-CBR universe, from the Big Bang to the the current era. Credit: Alex Mittelmann/Coldcreation The universe has been expanding since the Big Bang kickstarted the growth about 13.8 billion years ago.
And it is said to be getting faster in its acceleration as it gets bigger (illustrated).
Dark matter's gravity slows cosmic expansion, while dark energy pushes in the opposite direction and causes it to accelerate Read more: Follow us: @MailOnline on Twitter | DailyMail on Facebook
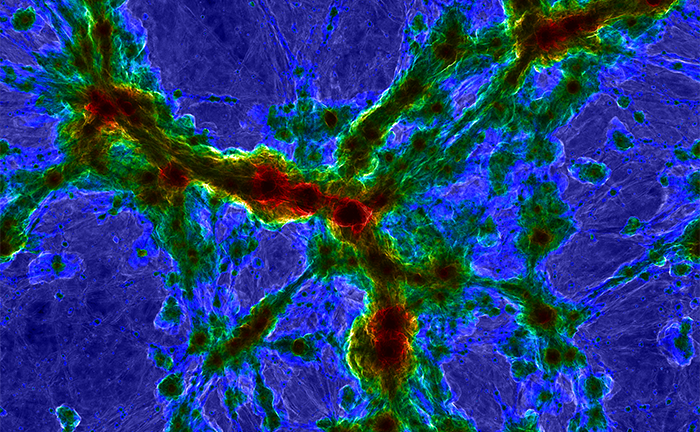
Composite which combines gas temperature (as the color) and shock mach number (as the brightness). Red indicates 10 million Kelvin gas at the centers of massive galaxy clusters, while bright structures show diffuse gas from the intergalactic medium shock heating at the boundary between cosmic voids and filaments. Credit: Illustris Team
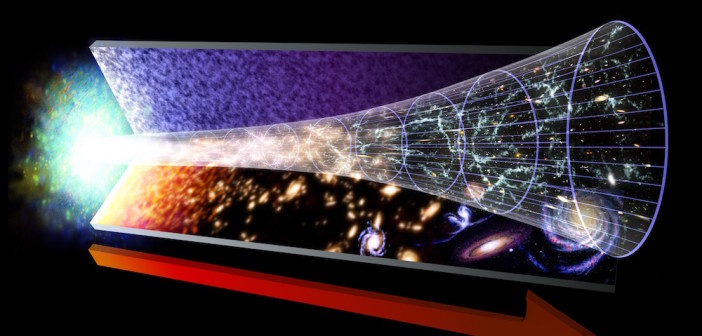
This illustration shows the evolution of the Universe, from the Big Bang on the left, to modern times on the right. Image: NASA
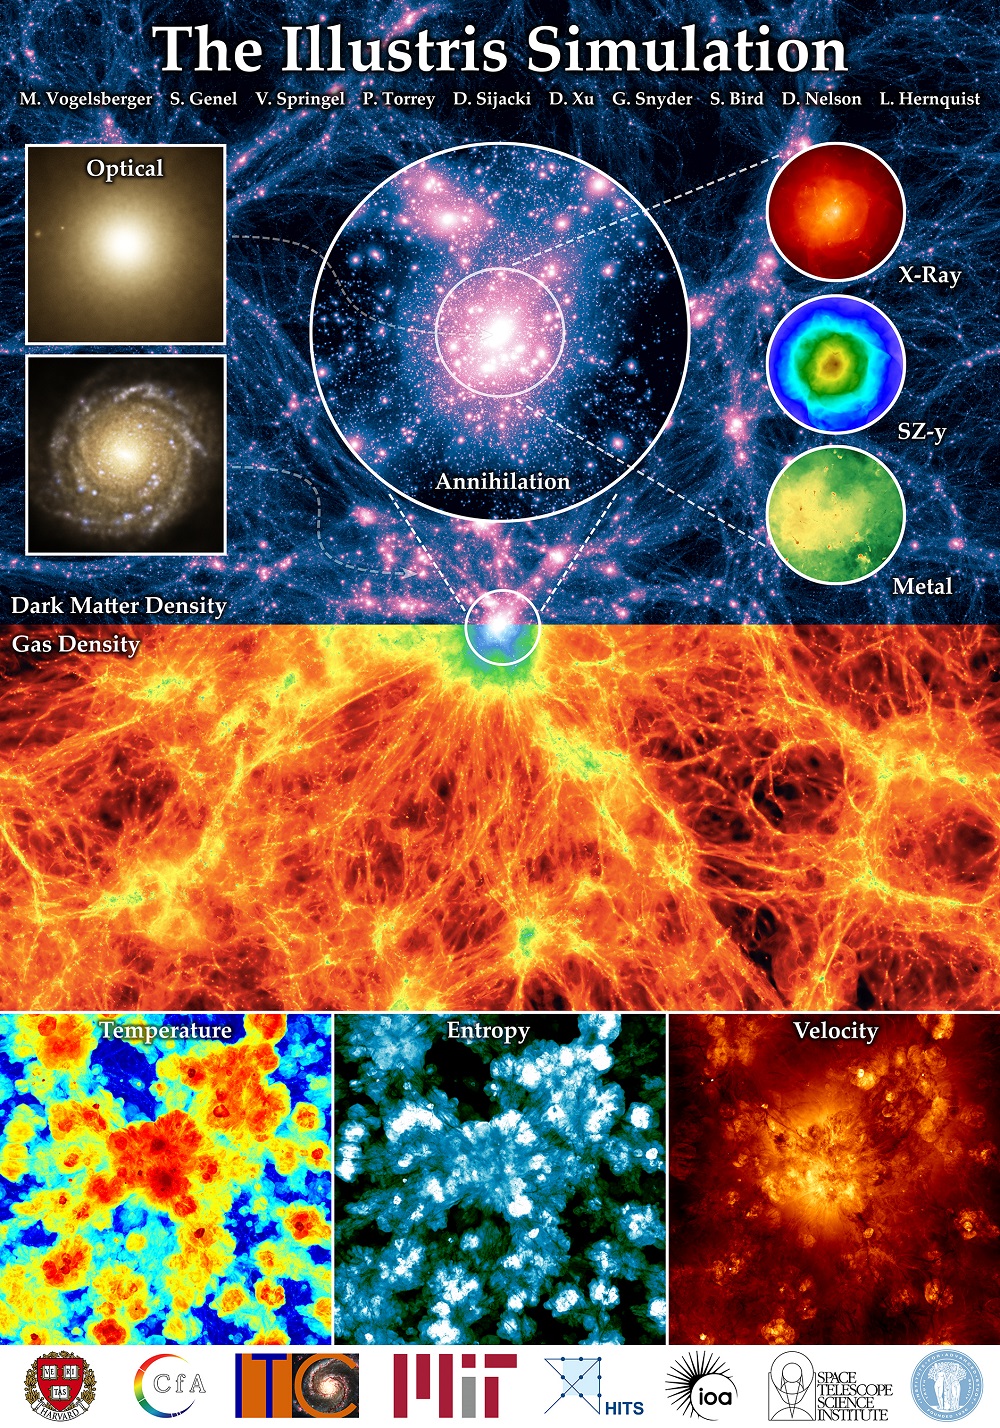
Illustris simulation overview poster. Shows the large scale dark matter and gas density fields in projection (top/bottom). Credit: Illustris Project
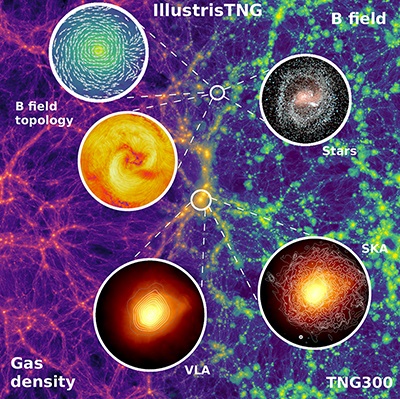
Gas density (left) and magnetic field strength (right) centered on the most massive galaxy cluster. Credit: Illustris Team
Cosmologists Create Largest Simulation of Galaxy Formation, Break Their Own Record
Illustris' News Release
Illustris Simulation: Most detailed simulation of our Universe
The Illustris simulation is the most ambitious computer simulation of our Universe yet performed. The calculation tracks the expansion of the universe, the gravitational pull of matter onto itself, the motion of cosmic gas, as well as the formation of stars and black holes. These physical components and processes are all modeled starting from initial conditions resembling the very young universe 300,000 years after the Big Bang and until the present day, spanning over 13.8 billion years of cosmic evolution. The simulated volume contains tens of thousands of galaxies captured in high-detail, covering a wide range of masses, rates of star formation, shapes, sizes, and with properties that agree well with the galaxy population observed in the real universe. The simulations were run on supercomputers in France, Germany, and the US. The largest was run on 8,192 compute cores, and took 19 million CPU hours. A single state-of-the-art desktop computer would require more than 2000 years to perform this calculation. Find out more at: Publication: "Properties of galaxies reproduced by a hydrodynamic simulation", Vogelsberger, Genel, Springel, Torrey, Sijacki, Xu, Snyder, Bird, Nelson, Hernquist, Nature 509, 177-182 (08 May 2014) doi:10.1038/nature13316 Music: moonbooter Institutes: Massachusetts Institute of Technology, Harvard University, Heidelberg Institute for Theoretical Studies, University of Cambridge, Institute for Advanced Study Princeton, Space Telescope Science Institute
Click here to return to top of page
Astronomers have gone so far as to map where most of the dark matter is in the universe.
Here�s a graphic showing the distribution of dark matter in the universe.
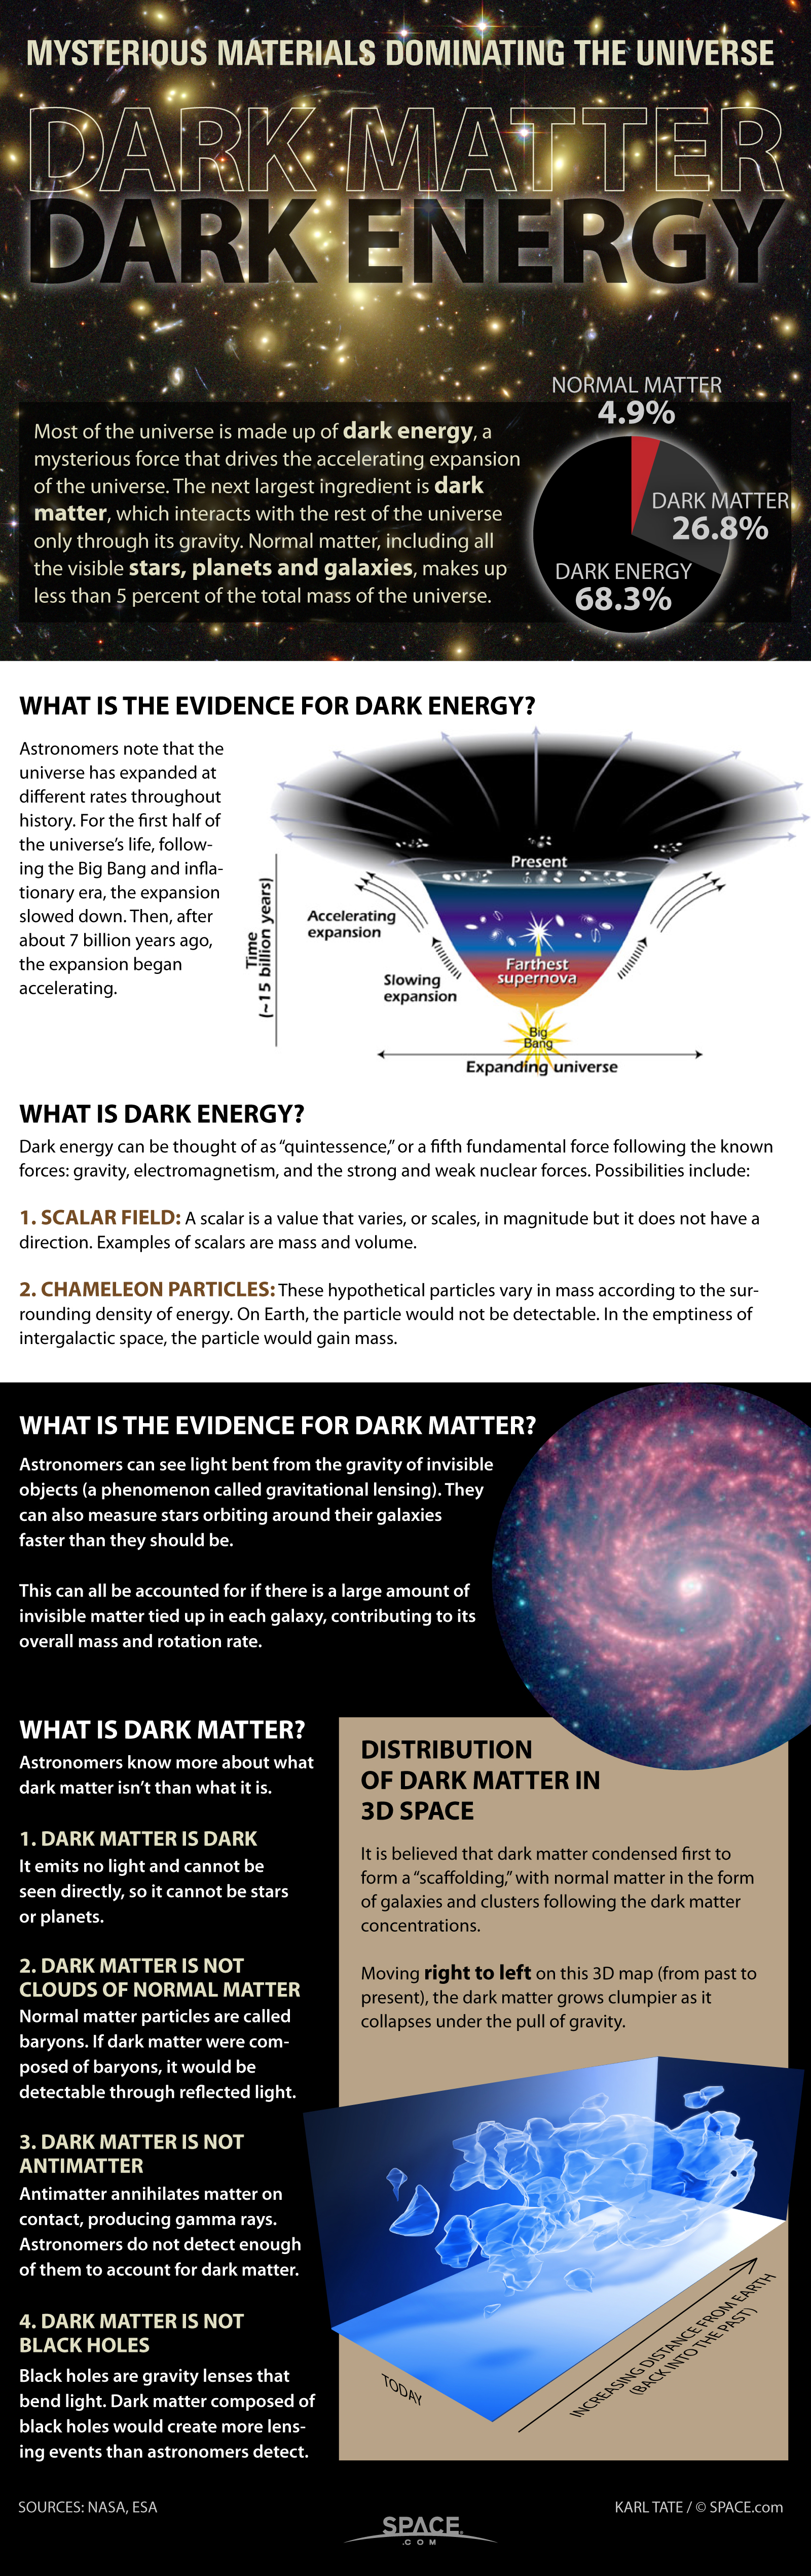
Dark Matter/Dark Energy Infographic
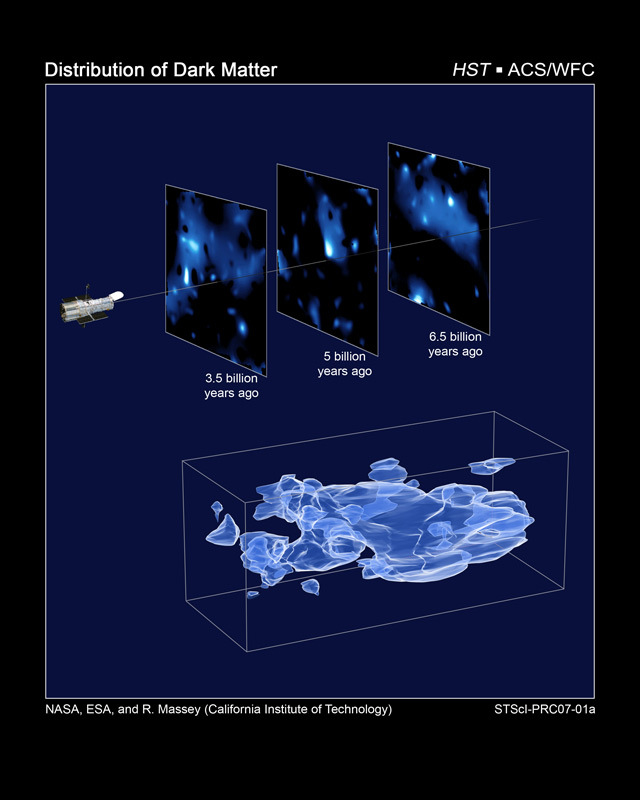
This three-dimensional map offers a first look at the web-like large-scale distribution of dark matter.
The map reveals a loose network of dark matter filaments, gradually collapsing under the relentless pull of gravity,
and growing clumpier over time. Credit: NASA, ESA, and R. Massey (California Institute of Technology)
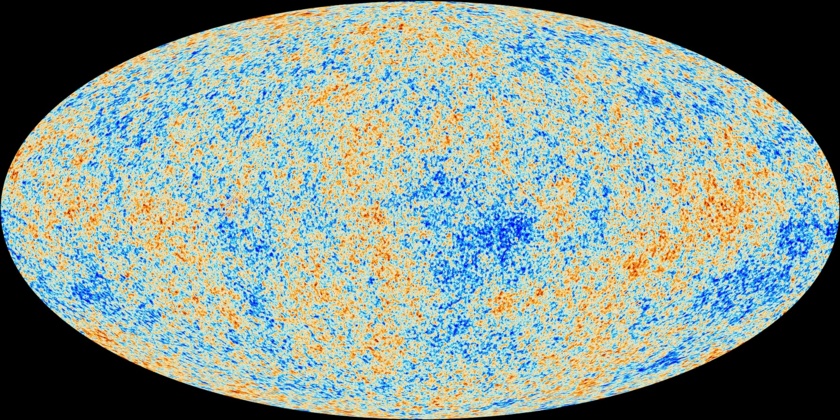
An Echo of the Big Bang
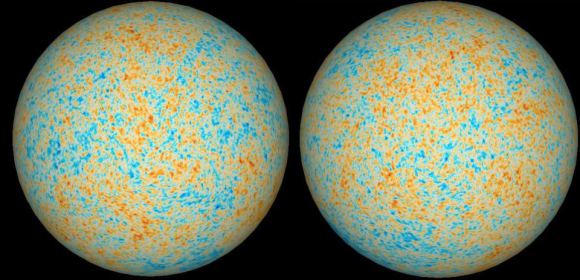
The anisotropies of the cosmic microwave background (CMB) as observed by Planck.
The CMB is a snapshot of the oldest light in our Universe, imprinted on the sky when the Universe was just 380 000 years old.
It shows tiny temperature fluctuations that correspond to regions of slightly different densities, representing the seeds of all future structure:
the stars and galaxies of today.
ESA and the Planck Collaboration - D. Ducros
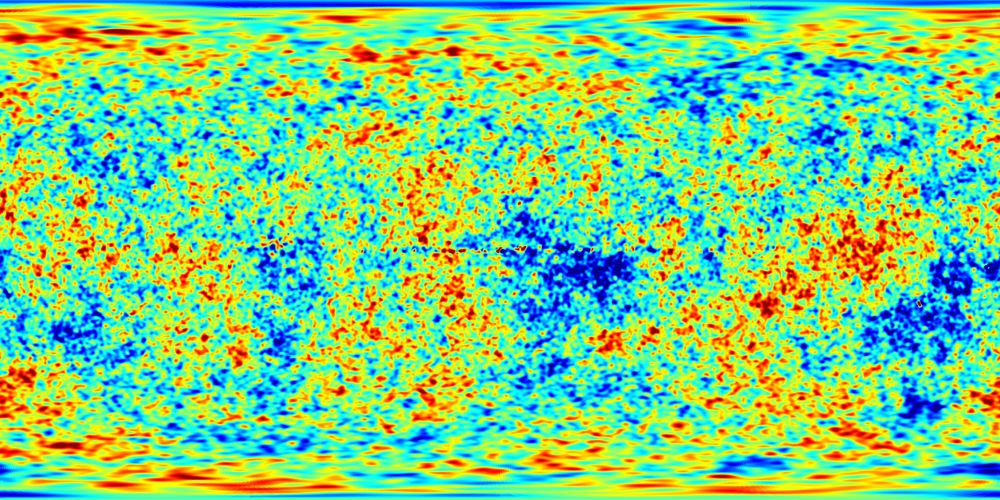
A flat map of the CMB
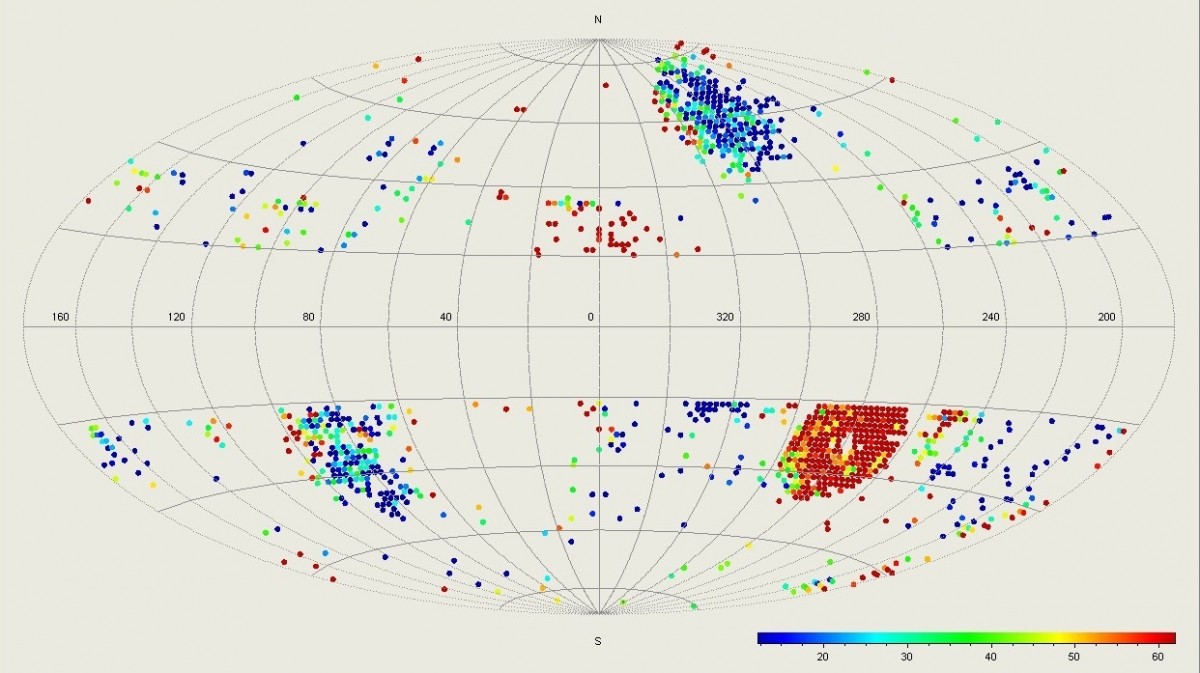
We Might Be Totally wrong about the expansion of the Universe
Fluctuation anomalies in the cosmic microwave background. Credit: V. G. Gurzadyan and R. Penrose.
Such a message, Penrose argues, could be encoded in the cosmic microwave background (CMB).
While the CMB is fairly uniform, it does have small fluctuations in temperature.
The scale at which these fluctuations occur tells us about the overall structure of our Universe.
But there are also regions where the fluctuations are more extreme than we’d expect. These anomalies aren’t highly unusual,
but they are interesting enough that some have speculated they might be caused by another Universe.
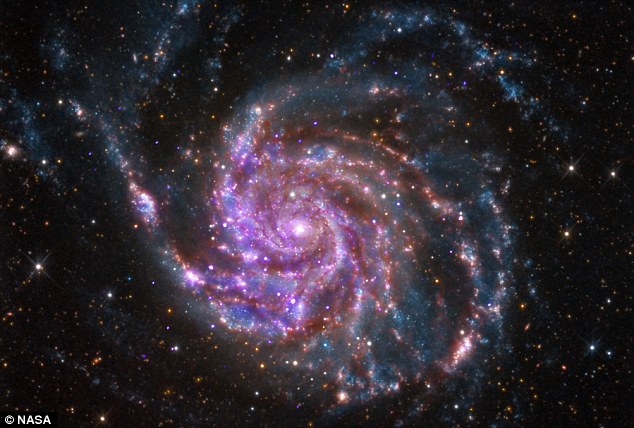
Galaxy M101, one of the galaxies in the study. Credit: NASA/JPL-Caltech
BEYOND WIMPS: EXPLORING ALTERNATIVE THEORIES OF DARK MATTER 21 Mar , 2016 by Matt Williams
Image from Dark Universe, showing the distribution of dark matter in the universe.
Credit: AMNH
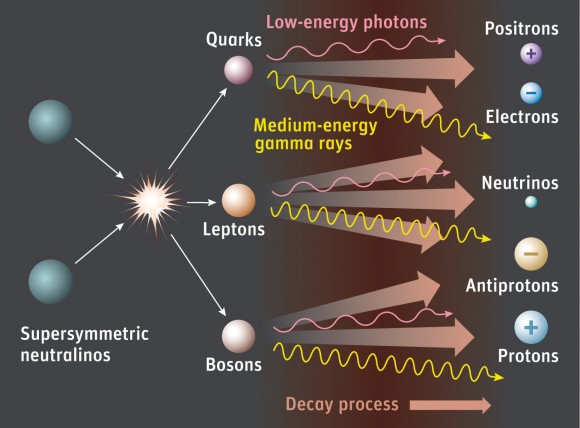
According to supersymmetry, WIMPs annihilate each other, creating a cascade of particles and radiation
that includes medium-energy gamma rays.
Credit: Sky & Telescope / Gregg Dinderman. Credit: AMNH
Massive 3D map of faraway galaxies to aid search for dark energy
"Using this map we will now be able to make the most accurate possible measurements of dark energy,"
said researcher Florian Beutler.
By Brooks Hays | July 14, 2016 at 3:02 PM
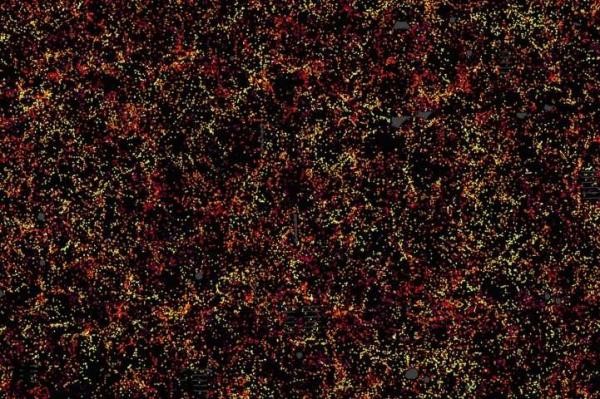
A small sliver of the 3D map of the distant universe. Each dot represents a galaxy six billion years into the past.
The color indicates the galaxy's distance from Earth.
Photo by Daniel Eisenstein/SDSS-III
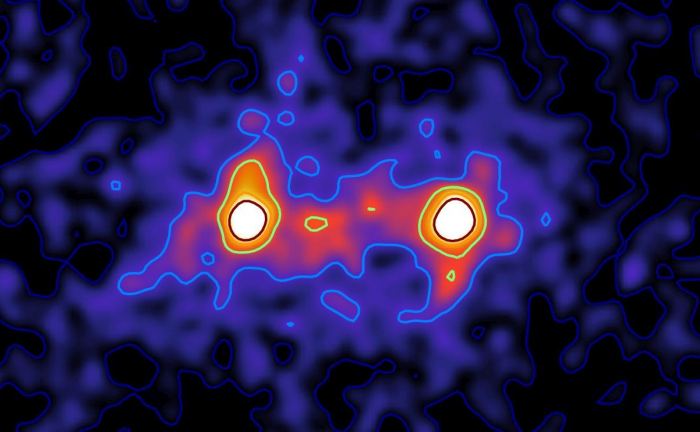
RESEARCHERS IMAGE DARK MATTER BRIDGE BETWEEN GALAXIES
This false color, composite image shows two galaxies, white, connected by a bridge of dark matter, red. The two galaxies are about 40 light years apart. Image: S. Epps & M. Hudson / University of Waterloo
The Dark Energy Survey!
Click here to return to top of page
The Universe is the Same, Everywhere We Look. Even More than Cosmologists Predicted
No matter which direction you look in the Universe, the view is basically the same if you look far enough. Our local neighborhood is populated with bright nebulae, star clusters, and dark clouds of gas and dust. There are more stars toward the center of the Milky Way than there are in other directions. But across millions, and billions, of light-years, galaxies cluster evenly in all directions, and everything starts to look the same. In astronomy, we say the Universe is homogeneous and isotropic. Put another way, the Universe is smooth.
The edge of the observable universe mapped onto a celestial sphere. Credit: Planck Collaboration
Large surveys of the cosmos show it is homogeneous. Credit: 2dF Galaxy Redshift Survey
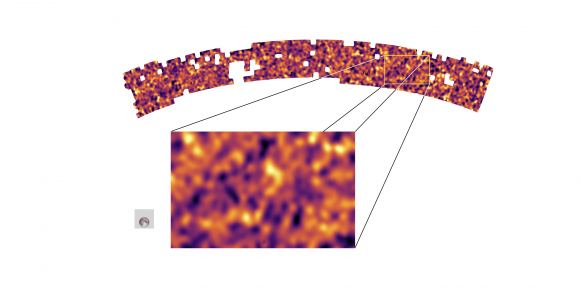
Part of the KiDS map, showing variations in cosmic density. Credit: B.Giblin, K.Kuijken and the KiDS team
Click here to return to top of page
ARTICLES
ARTICLES from Universe today
Universe today's CATEGORY: COSMOLOGY/P>
Universe Today's TAG: COSMIC MICROWAVE BACKGROUND
Universe Today's TAG: GALAXY CLUSTERS
The Universe is the Same, Everywhere We Look. Even More than Cosmologists Predicted
Click here to return to top of page