Statistical History of UFOs
Of more than 12,000 sightings eventually
registered by the Air Force's Project Blue Book, over 90% were attributed to
unremarkable causes such as misidentifications of Venus or weather balloons, or
as hoaxes. Surely there are errors in attribution, but activists and skeptics
agree that the vast majority of UFO reports indicate nothing extraordinary.
While valueless for physical scientists or
engineers, these sightings are useful for sociologists, showing the context in
which ET claims occur. For example, UFOs are usually seen after dark but before
midnight, and more often in warm months than winter. This reflects the times
when people are outside looking at the night sky. Many nations report UFOs, but
the United States is the center of activity. Within the U.S. the geographical
distribution of sightings correlates roughly with density of non-urban
population. Few reports come from urban areas, probably because city lights
obscure the night sky.
The Air Force count
of UFO sightings ceased with Blue Book’s demise. That loss was remedied by
ufologists, one of whom, Larry Hatch, has for 20 years tabulated sightings
worldwide and posted them in graphical format on the internet (http://www.larryhatch.net/).
Mr. Hatch generously provided me with his raw yearly counts of North American
sightings for the years 1947 through 2004. Like Blue Book, Hatch’s unit of
analysis is the UFO event, i.e., the sighting of one or more extraordinary
objects in the sky, or if on the ground thought capable of flight, at a
particular time and place by one or more observers. Sources for his compilation
include Blue Book; journals, newsletters, and encyclopedias from UFO
organizations; news media; and private catalogs. These pass through his personal
filter, weeding out obvious hoaxes, double entries, and misidentified mundane
events.[i]
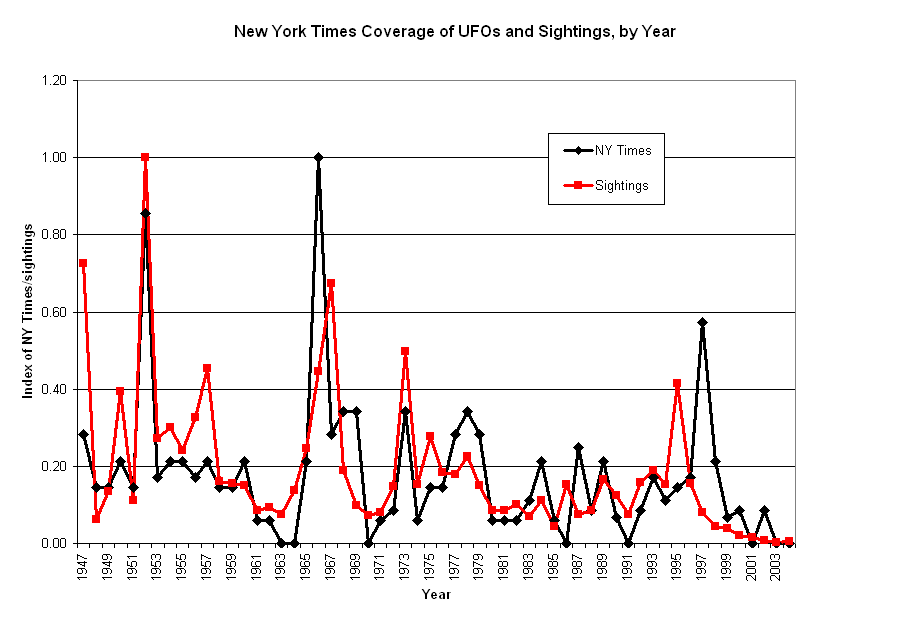
I divided Hatch’s yearly count by 811, the maximum count in a single year
(1952), producing an indicator of sightings with a maximum value of 1.0.
The New York Times
is the nation’s leading newspaper, an agenda setter for other news organs, and
the best indexed newspaper during the postwar decades. I tabulated the number of
articles about flying saucers/UFOs in the annual New York Times Index
from 1947 to 2004 and divided each year’s coverage by the amount in 1966, the
year of maximum coverage, producing again an indicator with a maximum value of
1.0. Times coverage correlates highly (r = .78) with yearly counts of
magazine articles about UFOs listed in Readers’ Guide to Periodical
Literature, adequately indicating years of high and low journalistic
attention across the nation.
UFO sightings and
Times coverage, both graphed in Figure 9-1, are correlated from year to year
(r = .62), rising and falling in concert.[ii]
After the burst of saucer sightings and news coverage in early summer of 1947
there was relative quiet in 1948-51, then a sharply defined burst in 1952, and a
return to relative quiet in 1953-65. Both indicators peak again -- not always
simultaneously -- in 1966-67, 1973, and 1995-97.

[i]
Since Hatch’s pre-1970 counts are partly derived from Blue Book counts,
it is unsurprising that the two are highly correlated (r = .77) for the
period 1948-68. After 1969, with the Blue Book registry gone, the
collection of UFO reports may have been less effective, contributing to
the subsequent appearance of generally lower counts. This downward
counting bias, if it exists, should not affect the detection of
post-1969 years with extremely high or low sighting activity.
[ii]
Larry Hatch learned of some sightings from news reports, raising the
possibility that the indicators are correlated as an artifact of joint
measurement. However, since most sightings are not reported in the
national news, and most national news stories are not about particular
sightings, any methodological conflation must be slight.
