


ABSTRACT
Blueshifted absorption lines in the X-ray spectra of an active galactic nucleus (AGN) show that ultrafast outflows with typical velocities
1 INTRODUCTION
It is now well established that a supermassive black hole (SMBH) lies in the centre of most galaxies, and further that it accretes material through a disc. Over the past 15 yr, observations with a new generation of X-ray observatories (Jansen 2001; Mitsuda 2007) have revealed ultrafast outflows (UFOs), probably launched from regions of the disc accreting at super-Eddington rates (King & Pounds 2003) where the momentum in the radiation field released by accretion can overcome the inward pull from the black hole’s gravity. UFOs appear to be a common component of luminous AGNs (Tombesi et al. 2010, 2011; Gofford et al. 2013). With typical velocities of
The archetypal UFO is found in the luminous Seyfert galaxy PG1211+143 (Pounds et al. 2003). To further explore the properties of this powerful UFO, the XMM–Newton X-ray Observatory carried out seven full-orbit (∼100 ks) observations over 5 weeks in 2014, with a total on-target exposure of ∼ 630 ks. Full details of observing times, data reduction procedures, and count rates are given in Lobban et al. (2016). The stacked data revealed a surprisingly complex spectrum, with the hard X-ray pn camera (Strueder et al. 2001) finding multiple blueshifted absorption lines, identified with highly ionized Fe between ∼ 6.6 and 8.8 keV and outflow velocities of ∼0.06c, ∼0.13c, and ∼ 0.18c (Pounds et al. 2016a). Independent support for the multiple outflow velocities was found in higher resolution spectra (Pounds et al. 2016b) using soft X-ray data from the coaligned Reflection Grating Spectrometer (RGS; den Herder et al. 2001). While all previous UFO detections report a single velocity, although with repeated observations sometimes finding a different value, the 2014 XMM–Newton observation of PG1211+143 was inconsistent with the unique and stable outflow expected from a static axisymmetric accretion disc (Shakura & Sunyaev 1973; Pounds, Lobban & Nixon 2017). Furthermore, a recent orbit-by-orbit study of the RGS data (Reeves et al. 2018) has shown significant inter-orbit variability in outflow column densities over the 5 week campaign, perhaps providing a further indication of short-term inner disc variability.
The highly ionized state of such ultrafast AGN winds limits strong absorption to the heavier metals, where features of Fe stand out because of its high astrophysical abundance. For that reason, all current UFO discoveries essentially rest on the detection of blueshifted Lyman-α and/or He-α resonance absorption lines of highly ionized Fe (respective rest energies of 6.70 and 6.96 keV). While spectral modelling, typically over the 2–10 keV band, also includes absorption in lighter metals such as Ca, S, and Si (e.g. Pounds & Page 2006), little attention has been given to other spectral features below ∼6 keV, where redshifted Fe K absorption lines might be seen. The few historical exceptions (Nandra et al. 1999; Dadina et al. 2005; Reeves et al. 2005; Cappi et al. 2009; Giustini et al. 2017) are of isolated absorption lines where the identification – and hence velocity – of the absorber remained unclear. In the most detailed report (Dadina et al. 2005) two (of five) Beppo-Sax observations of the Seyfert 1 galaxy Mkn 509 detected an absorption line at ∼5.5 keV (rest frame), suggesting the feature was variable on time-scales as short as ∼20 ks, which the authors argued was more easily reconciled with inflowing matter than with a pure gravitational redshift or failed jet. Of particular relevance to this study are unidentified absorption lines at ∼4.56 and ∼5.33 keV in the Chandra observation of PG1211+143 (Reeves et al. 2005). While these earlier reports hint at fast evolving and complicated dynamics in the inner disc, so far none has provided compelling evidence for a high-velocity inflow that could represent a direct challenge to the standard picture of a circular, planar disc slowly accreting on to the central black hole.
However, recent theoretical arguments suggest that such infall may be common in AGNs, where allowing for the possibility that the accretion disc may be misaligned to the central black hole spin reveals new physical effects. Numerical simulations of misaligned discs around a spinning black hole have shown that the Lense–Thirring effect can overwhelm the internal communication of angular momentum within the disc. This causes the disc to break, leading to individual rings of gas that precess effectively independently – called disc tearing (Nixon et al. 2012; Dogan et al. 2015; Nealon, Price & Nixon 2015; Nixon 2015; Dogan et al. 2018). When these rings interact, their opposed velocity fields create shocks that rob the gas of rotational support, allowing it to fall inwards towards the black hole where residual angular momentum causes the gas to re-circularize at a smaller radius.
Motivated by these theoretical ideas and the paucity of relevant observations, we have carried out a thorough search for rapidly inflowing matter, on a range of time-scales, as part of an ongoing orbit-by-orbit analysis of the hard X-ray data from the 2014 XMM–Newton observation of PG1211+143.
2 REDSHIFTED ABSORPTION
The new analysis is based primarily on the high throughput pn camera, while checking for consistency – as necessary – with simultaneous spectral data from the MOS camera (Turner et al. 2001) and higher resolution spectra from the RGS.
As in the published outflow studies, spectral modelling uses the XSPEC v12 software package (Arnaud 1996), with all spectral fits including absorption due to the line-of-sight Galactic column of N
The starting point in modelling each pn data set is the stacked X-ray spectrum (Pounds et al. 2016a), where the continuum from 1 to 10 keV is modelled by a double power law, with discrete spectral features imposed by overlying matter being compared with grids of pre-computed photoionized absorption and emission spectra, based on the XSTAR code (Kallman et al. 1996). To facilitate comparison with previous outflow analyses (e.g. Pounds et al. 2016a), for the pn and MOS data we use the publicly available grid25 (v21), which assumes a power-law continuum of Γ=2 and a fixed turbulence velocity 200 km s−1, and custom-built grids derived from the observed source spectrum (Pounds et al. 2016b) for the RGS spectral analysis. Free parameters in the spectral fitting include the ionization, column density, and observed redshift (or blueshift) of photoionized matter, with continuum normalization also free to vary on re-fitting.
We find no significant evidence for strongly redshifted absorption1 in the first observing period (spacecraft orbit number 2652, or rev2652), but that outcome changed for rev2659, just 2 weeks later.
2.1 A strong inflow in rev2659
Modelling the 1–10 keV pn spectrum from rev2659 revealed a strong absorption component at the extreme redshift ∼0.483 ± 0.008. With a high column density (N
To check that the model was not impaired by some unknown data artefacts, the redshifted component was removed from the XSTAR model and the ratio of data to model visually examined. Fig. 1 (top) reproduces that ratio plot, showing an array of absorption lines identified with resonance transitions in H- and He-like ions of Fe, Ca, Ar, S, and Si. The two strongest absorption lines are identified with Lyman-α and He-α of Fe, with individual redshifts closely matching the XSTAR model component, while the array as a whole yields a weighted mean observed redshift of 0.476 ± 0.005. The Ca line at ∼2.6 keV is most likely a blend of H- and He-like resonance lines. Table 1 lists each observed line energy, obtained by scanning a narrow negative Gaussian across the ratio plot, with the individual line widths set comparable to the pn detector resolution at each photon energy. We note the detector resolution corresponds to an intrinsic line width of the order of 1500 km s−1 at 5 keV, substantially greater than the preferred XSTAR model value, indicating the observed absorption line widths are essentially unresolved in these data.
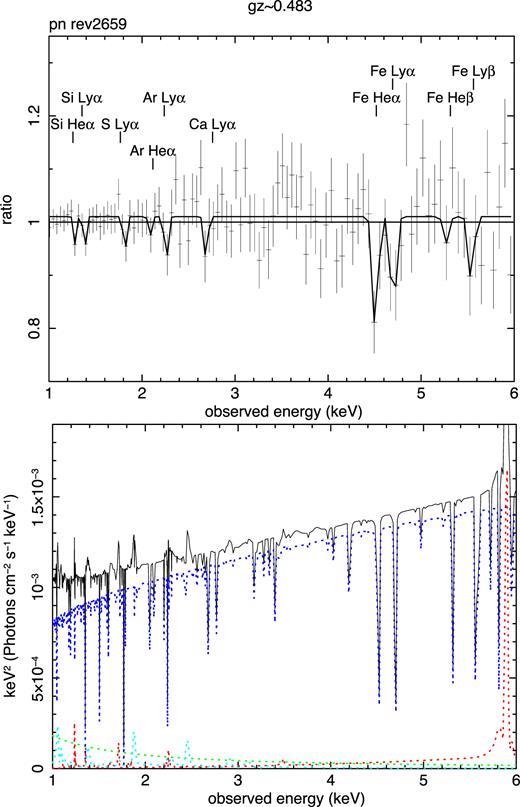
(Top) Ratio of pn data to model for the rev2659 observation when the absorption component with redshift gz∼0.483 is removed and the model re-fitted. Absorption lines identified with resonance K-shell transitions in Fe, Ca, Ar, S, and Si yield a weighted mean redshift of 0.476 ± 0.005. (Lower) The initial spectral model, with a hard power law (dark blue) showing the imprint of the redshifted absorber, the unabsorbed soft power law found in difference spectra (green), and emission from an ionized reflector (red) and the photoionized outflow (light blue).
(Top) Ratio of pn data to model for the rev2659 observation when the absorption component with redshift gz∼0.483 is removed and the model re-fitted. Absorption lines identified with resonance K-shell transitions in Fe, Ca, Ar, S, and Si yield a weighted mean redshift of 0.476 ± 0.005. (Lower) The initial spectral model, with a hard power law (dark blue) showing the imprint of the redshifted absorber, the unabsorbed soft power law found in difference spectra (green), and emission from an ionized reflector (red) and the photoionized outflow (light blue).
Narrow Gaussian lines sequentially fitted to the identified absorption features in the rev2659 pn data shown in Fig. 1. Line widths were set comparable to the relevant pn detector resolution and all line energies are in keV. The proposed identification and corresponding redshift for each line are listed, together with the related improvement in Δχ2 after re-fitting. The relatively high redshift of the Ca Ly-α line may be explained by a blend with the corresponding He-α line, though its low statistical weight does not affect the array redshift.
| Line i.d. | Obs energy | Lab energy | Obs redshift | Δχ2 |
|---|---|---|---|---|
| Fe Ly-α | 4.701 ± 0.010 | 6.96 | 0.481 ± 0.004 | 8/2 |
| Fe He-α | 4.511 ± 0.011 | 6.703 | 0.486 ± 0.004 | 15/2 |
| Fe Ly-β | 5.543 ± 0.020 | 8.25 | 0.488 ± 0.005 | 4/2 |
| Fe He-β | 5.27 ± 0.08 | 7.88 | 0.495 ± 0.023 | 1/2 |
| Ca Ly-α | 2.67 ± 0.025 | 4.09 | 0.532 ± 0.014 | 2/2 |
| Ca He-α | 2.67 ± 0.025 | 3.903 | 0.462 ± 0.014 | 2/2 |
| Ar Ly-α | 2.257 ± 0.009 | 3.32 | 0.471 ± 0.006 | 5/2 |
| Ar He-α | 2.09 ± 0.09 | 3.140 | 0.50 ± 0.06 | 1/2 |
| S Ly-α | 1.814 ± 0.010 | 2.62 | 0.452 ± 0.016 | 4/2 |
| Si Ly-α | 1.382 ± 0.007 | 2.006 | 0.452 ± 0.008 | 5/2 |
| Si He-α | 1.283 ± 0.031 | 1.865 | 0.454 ± 0.025 | 7/2 |
Allowing for the cosmological redshift of PG1211+143 (0.0809) the observed redshift of 0.48 ± 0.01 corresponds to a Doppler-corrected inflow velocity v∼0.30 ± 0.01c. As this velocity is substantially higher than any of the three contemporary outflow velocities, we suggest the matter being a ‘failed outflow’ relatively unlikely, since a lower velocity outflow – launched from a larger radius – would have too much angular momentum to fall back at the higher velocity. The more interesting alternative is absorption in matter accreting from out-of-the-plane of the disc, and in line of sight to the hard X-ray continuum source (conventionally assumed to be a compact hot corona above the inner disc).
In the context of matter falling freely towards the SMBH, equating the infall velocity to the local free-fall velocity places the absorber near 20 Rg, where Rg is the gravitational radius. We note that
Independent support for the above finding is potentially available from the coaligned MOS camera (Turner et al. 2001), which was operated throughout the 2014 campaign. An initial check on the rev2659 MOS data did indeed find a highly redshifted absorption component, consistent with that reported from the pn data analysis, although the outflow components are less well constrained due to the lower sensitivity of the MOS above ∼6 keV. To obtain a common spectral fit with both data sets, we therefore re-fitted the pn model, described above, with the addition of the MOS data, and allowing the joint parameters to vary. The outcome was positive, with the redshifted absorber increasing in significance (Δχ2 of 26/3), while retaining a similar column density (NH∼
2.2 Absorption in the RGS soft X-ray spectrum of rev2659
Finally, higher resolution soft X-ray spectra (albeit with lower count rates) from the RGS instrument, also coaligned with the pn camera, are examined to check for possible lower ionization matter in the infalling stream. We recall that detection of cooler embedded matter provided important confirmation of multiple velocities in the outflow spectrum of PG1211+143 (Pounds et al. 2016b).
Again starting with the mean 2014 outflow spectrum, the rev2659 RGS data were re-modelled, now allowing for an additional redshifted absorber. That search was successful, with a soft X-ray absorption component (Δχ2 of 14/3; P = 3 × 10⁻³) being found at the same extreme redshift (∼0.483 ± 0.003), though with a much lower column density (N
Confidence in the highly redshifted soft X-ray absorption and emission components is supported by the detection of several key features in the spectral residuals, when the high-redshift components are removed from the XSTAR model fit (Fig. 2). While the plot is much ‘noisier’ than for the pn hard X-ray data, the strong 1s–2p resonance absorption lines of He-like O and Ne are both indicated at a redshift consistent with the XSTAR model value, while the broad absorption line at ∼24.2 Å corresponds to a similar redshift when identified with the Fe-M UTA, albeit with lower precision as the rest wavelength of the UTA depends on the ionization distribution. Narrow emission lines identified with O Ly-α and the forbidden line of the O vii triplet also match the same inflow redshift.
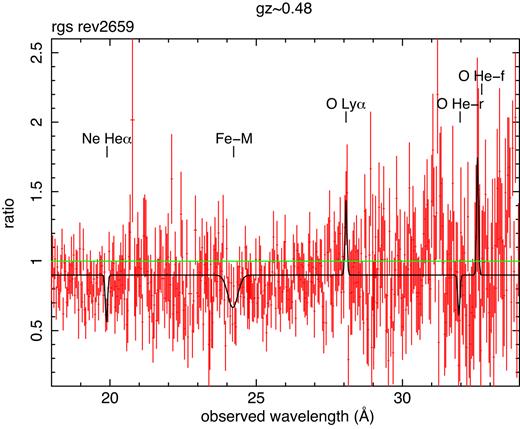
Ratio of RGS data to model for rev2659 when absorption and emission components with redshift z∼0.48 are removed. Absorption lines identified with the 1s–2p resonance lines of He-like O and Ne are detected at a redshift consistent with the XSTAR model value. The broad absorption line at ∼24.2 Å corresponds to a similar redshift when identified with the Fe-M UTA, although with lower precision as the rest wavelength of the UTA depends on the ionization distribution. Narrow emission lines of O viii Ly-α and the forbidden line of the O vii triplet also match the model redshift. The line markers are located at wavelengths corresponding to a redshift of 0.48.
Ratio of RGS data to model for rev2659 when absorption and emission components with redshift z∼0.48 are removed. Absorption lines identified with the 1s–2p resonance lines of He-like O and Ne are detected at a redshift consistent with the XSTAR model value. The broad absorption line at ∼24.2 Å corresponds to a similar redshift when identified with the Fe-M UTA, although with lower precision as the rest wavelength of the UTA depends on the ionization distribution. Narrow emission lines of O viii Ly-α and the forbidden line of the O vii triplet also match the model redshift. The line markers are located at wavelengths corresponding to a redshift of 0.48.
Two less strongly redshifted components are also found in the RGS spectrum, at z∼0.19 ± 0.01 (Δχ2 of 17/3: P = 7 × 10⁻⁴) and z∼0.17 ± 0.01 (Δχ2 of 15/3: P = 1.8 × 10⁻³). While the lower implied velocities might simply represent a line of sight at a larger angle to the flow stream, the required large deviation in the flow vector seems unlikely so close to the SMBH.
Alternatively, assuming each flow is along the line of sight, the corresponding inflow velocities would be ∼0.080c and ∼0.097c. Both components are highly ionized, with logξ ∼3.4 erg cm s−1, similar to that for the pn detection, but with respective column densities of N
An intriguing speculation is that the lower velocity and column density of these soft X-ray inflows represent the primary, highly ionized flow seen along a different sight line (in this case to the soft X-ray continuum), providing an upstream view through an accelerating flow approaching the SMBH. Support for that conjecture is provided by the absence of a higher energy spectral counterpart to the lower redshift soft X-ray absorbers in the pn data.
If a true upstream measure, the lower velocity of the highly ionized soft X-ray absorber, v∼0.10c, would correspond to a radial distance for the absorber of ∼200 Rg, conceivably on a sight line to the larger scale, thermal disc emission. The much lower column density might then be qualitatively consistent with a converging – as well as accelerating inflow. While such deductions are limited by having only two spectral data points, the potential of future observations with higher spectral resolution and photon grasp is clear.
3 EVIDENCE OF REDSHIFTED ABSORPTION IN LATER ORBITS
The pn data from the third observation, in rev2661, were examined as above, finding only an upper limit for an inflow at a redshift near ∼0.48, with N
Summary of inflow components detected in modelling of pn spectra from three individual spacecraft orbits and three subsections of the orbit 2659 data from the 2014 XMM–Newton campaign. The final two columns show the improvement in χ2 by inclusion of the redshifted absorption component and the corresponding false detection probability.
| Rev | Obs redshift | NH × 1023 | log ξ | Velocity (c) | Δχ2 | P value |
|---|---|---|---|---|---|---|
| 2659 | 0.483 ± 0.008 | 5.6 ± 2.4 | 3.48 ± 0.05 | 0.30 ± 0.01 | 18/3 | 4 × 10⁻⁴ |
| 2659(1) | 0.484 ± 0.014 | 2.6 ± 3.5 | 3.4 ± 0.1 | 0.31 ± 0.01 | 10/3 | 2 × 10⁻² |
| 2659(2) | 0.485 ± 0.012 | 5.7 ± 3.6 | 3.5(f) | 0.31 ± 0.01 | 6/2 | 5 × 10⁻² |
| 2659(3) | 0.450 ± 0.009 | 18 ± 5 | 3.5 ± 0.1 | 0.29 ± 0.01 | 20/3 | 2 × 10⁻⁴ |
| 2661 | 0.35 ± 0.01 | 5.3 ± 2.3 | 3.50 ± 0.17 | 0.22 ± 0.01 | 9/3 | 3 × 10⁻² |
| 2666 | 0.34 ± 0.02 | 0.3 ± 0.1 | 2.6 ± 0.2 | 0.21 ± 0.01 | 14/3 | 3 × 10⁻³ |
To complete the search for redshifted absorption, the pn data analysis was repeated for the remaining four XMM–Newton orbits, revs2663, 2664, 2666, and 2670, spaced at intervals of ∼4, ∼2, ∼4, and ∼8 d, respectively. Significant absorption was found at z ∼0.34 ± 0.02 in rev2666, but with a lower ionization parameter and column density (than rev2661). Table 2 summarizes the pn inflow detections, with that in rev2659 being the most remarkable, in terms of redshift and a large and variable column density, with the simultaneous MOS and RGS data providing independent support for the ∼0.30c inflow.
All redshift (and inflow velocity) measurements are formally lower limits, as they assume the flow is aligned with the line of sight. However, we suggest this is likely to be the case for inflowing matter close to the black hole and adjacent corona.
4 DISCUSSION
While several previous observations have suggested the presence of single redshifted absorption lines in AGN X-ray spectra, we report here the first detection of a physically realistic redshifted absorption line spectrum, consistent with highly ionized matter falling inwards at v∼0.3c. Such an unambiguous detection of strongly redshifted X-ray absorption in an AGN provides direct evidence for substantial highly ionized matter close to – and apparently converging on – the SMBH. Variability on time-scales of hours, as described below, indicates a fine spatial or temporal structure in the matter crossing the line of sight. Here we briefly consider the implication of this result, and why such clear evidence has remained elusive until now.
The detection of ultrafast and highly ionized outflows in early X-ray spectra of the luminous, narrow line Seyfert galaxy PG1211+143 (Pounds et al. 2003) and QSO PDS 456 (Reeves, O'Brien & Ward 2003) opened a new field of study of AGNs, made possible by the uniquely high throughput of X-ray spectrometers on ESA’s XMM–Newton X-ray Observatory, launched in late 1999. King & Pounds (2003, 2015) note that such winds are a natural result of a high accretion rate, with excess matter being driven off by radiation pressure when the accretion rate exceeds the local Eddington limit (Shakura & Sunyaev 1973).
While this picture provides a satisfactory explanation of most UFOs, with each observation yielding a unique wind velocity, an extended 5 week study of PG1211+143 in 2014 found a more complex outflow profile, with velocities of ∼0.06c, ∼0.13c, and ∼0.18c detected in the stacked data set. Such a complexity was clearly inconsistent with a wind profile launched from the classical (flat axisymmetric) accretion disc of Shakura & Sunyaev 1973, suggesting some intrinsic disc instability or rapidly variable accretion rate in the inner disc. As noted above, rapidly varying accretion could be a direct consequence of the way in which AGNs accrete, where matter falls towards the SMBH with essentially random orientations (King & Pringle 2006, 2007).
In that case Lense–Thirring precession will cause misaligned orbits to precess around the black hole spin vector, with the inner disc warping and rings of matter breaking free (Fig. 3). Collisions between neighbouring rings might then lead to matter falling inwards to a new radius defined by its residual angular momentum, where it may form a new disc. Simulations suggest material added to the inner disc from the ‘disc-tearing’ region can result in a substantial increase in the local accretion rate, allowing an otherwise sub-Eddington flow to become briefly ‘super-Eddington’. In that regard it is interesting to note that the distribution of UFO velocities from the XMM–Newton and Suzaku archival searches (King & Pounds 2015; fig. 4) is consistent with the expected range of tearing radius. With precession time-scales (for a black hole mass 4 × 10⁷ M⊙ and spin parameter 0.5) predicted to be of the order of weeks for radii of the order of 50 Rg, to a few years for radii of the order of 200 Rg (Nixon et al. 2012), the simultaneous detection of three primary wind velocities in the 2014 XMM–Newton observation of PG1211+143 appears feasible, with the hard X-ray source being viewed through three independently expanding shells of ionized gas.
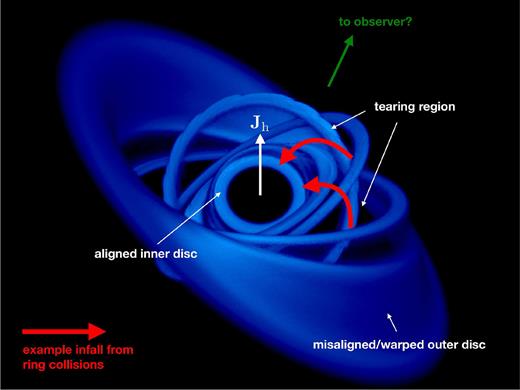
Characteristic disc structure from the simulation of a misaligned disc around a spinning black hole. The outermost regions are warped and remain misaligned. Inside this, several rings have broken free and are freely precessing through the Lense–Thirring effect. The innermost material has fallen from the shocks that occur between rings, and is aligned to the central black hole spin (it is the misaligned component of angular momentum that is cancelled in the shocks – and transferred to the hole through precession). Depending on the observer’s line of sight, the infalling matter may or may not obscure the central emitting regions. Note that the black hole spin vector is drawn as an arrow up the page, but this is the projection on to the page. The black hole spin vector points out towards the reader as well as in the direction drawn, such that the vector is normal to the innermost ring of gas.
Characteristic disc structure from the simulation of a misaligned disc around a spinning black hole. The outermost regions are warped and remain misaligned. Inside this, several rings have broken free and are freely precessing through the Lense–Thirring effect. The innermost material has fallen from the shocks that occur between rings, and is aligned to the central black hole spin (it is the misaligned component of angular momentum that is cancelled in the shocks – and transferred to the hole through precession). Depending on the observer’s line of sight, the infalling matter may or may not obscure the central emitting regions. Note that the black hole spin vector is drawn as an arrow up the page, but this is the projection on to the page. The black hole spin vector points out towards the reader as well as in the direction drawn, such that the vector is normal to the innermost ring of gas.
We suggest the detection of strongly redshifted X-ray absorption spectra, reported here, may represent the first direct observational evidence of disc tearing and thereby of the importance of random or ‘chaotic accretion’ in AGNs. While the observation is of high significance only in the XMM–Newton orbit rev2659, the extreme redshift (∼0.48) and inflow velocity (∼0.3c) indicate absorption in a significant body of matter plunging towards the SMBH at ∼20 Rg. Confidence in that detection is increased when the independent MOS data are included in a joint spectral fit, while further support is provided by the RGS detection of a smaller column of less ionized (presumably, higher density) matter, comoving with the primary inflow.
The transient nature of the rev2659 inflow largely explains why a compelling detection has not been reported before. Isolated claims are not uncommon, however, with several single-line detections noted in the ‘Introduction’ section, and both XMM–Newton and Suzaku archival searches finding – but not discussing – transient absorption lines in the region occupied by redshifted Fe K lines. Uniquely, the observation in rev2659 has both a sufficiently large redshift and high column density to reveal multiple absorption lines that - when matched with resonance lines of Fe, Ca, Ar, S and Si - share a common redshift. In quantifying that spectrum, the XSTAR analysis is key, since only by comparison with a set of physically realistic ionized absorption spectra can the significance be properly assessed. A valuable bonus of such a detailed modelling is in quantifying the key parameters (ionization, column density, apparent redshift) of the flow.
In the context of chaotic accretion, where disc tearing and subsequent shocking are predicted to lead to streams of matter falling towards the SMBH from essentially random directions, the highly variable nature of redshifted absorption, seen along a sight line to the centrally located hard X-ray continuum source, is perhaps no surprise. As each stream plunges towards the black hole the increasing density will allow a greater fraction of the accreting matter to pass across the line of sight. While the frequency of detections during the 5 week observation of PG1211+143 suggests multiple events, the data from rev2659 offer the best quantitative measure of an individual accreting stream, with the predicted time-scales for disc tearing placing this in terms of the overall accretion rate of PG1211+143.
If the conditions for disc tearing are satisfied, the infall of a single gas cloud should be detectable for a time of the order of ∼R/c, at intervals of
We use the higher resolution flow data of rev2659 (Table 2) to estimate the peak mass flow rate, where – as a stream of matter plunges towards the black hole – its increasing compactness ensures the third segment represents a maximum fraction passing through the line of sight. We assume a cylindrical inflow element at a radial distance 20Rg, with length 5Rg constrained by the well-defined velocity, and diameter 2Rg to allow a reasonable chance of detection along a line of sight to the hard X-ray source. The mean particle density is then NH/5Rg, and the observed mass element
Assuming an accretion efficiency η ∼ 0.1, the observed accretion rate would yield a luminosity of
Evidence for additional inflowing matter found in two of the remaining five XMM–Newton observations in 2014, with lower velocities and column densities (than in rev2659), might indicate infalling matter further from the SMBH. Details of all the positive detections are listed in Table 2, revealing a picture of one remarkably strong – and rapidly variable – inflow (in rev2659), which we suggest represents an infalling matter stream within ∼20Rg and lying close to the line of sight, and lower redshift absorption ∼4 and ∼14 d later, perhaps representing matter still having too much angular momentum to accrete.
Finally, we note the most likely alternative to the above picture, that of a failed outflow, is unlikely given that the inflow velocity in rev2659 is much higher than any observed outflow component in PG1211+143. Assuming that the latter arises from larger disc radii (with corresponding escape velocities), that material would have too much angular momentum to acquire the higher infall velocity observed. For the ‘failed-wind’ model to explain the data then requires the same velocity outflow to be unobservable for precisely the period in which the inflow is observed; that seems unlikely, requiring an uncomfortable degree of fine tuning.
5 CONCLUSIONS
The detection of strongly redshifted X-ray absorption in data from an extended XMM–Newton observation of the luminous Seyfert galaxy PG1211+143 has provided compelling evidence for the inflow of matter at
The transient nature of the strong inflow detected in the 2014 XMM–Newton data, with variability on a time-scale of hours, helps explain why a compelling detection has not been reported before. It may also be relatively rare to have a sight line to the hard X-ray source that passes through infalling matter so close to the black hole, and hence with such a high particle density, as we found in rev2659.
Looking ahead, X-ray absorption spectra obtained over different sight lines, with high cadence and resolution, together with parallel advances in theory and computation, offer the exciting prospect of mapping the fine structure of ionized flows and accretion close to the SMBH. The high spectral resolution of the microcalorimeter planned for the forthcoming Japanese XRISM mission will be well matched for studying the highly ionized matter characteristic of fast inflows. Such new data together with new and a broader search of archival XMM–Newton observations should provide the best opportunity for further exploration of accretion disc physics and black hole growth in AGNs prior to the launch of Athena, a decade hence.
ACKNOWLEDGEMENTS
XMM–Newton is a space science mission developed and operated by the European Space Agency and we acknowledge the outstanding work of ESA staff in Madrid in successfully planning and conducting the observations that underpin this paper. Our thanks are due to colleague Simon Vaughan for enlightening discussions on how best to present the statistical aspects of the reported analysis. CN holds an Ernest Rutherford Fellowship (ST/M005917/1) and AL is supported by a consolidated grant to Keele, both funded by the UK Science and Technology Facilities Council. Finally, we thank the referee for a careful and perceptive review of the initial manuscript.
